
In my last article for International Socialism 18 months ago I argued that the Great Recession of 2008-9 that devastated the world capitalist economy had not been followed by a recovery in investment and output in the “normal” way, as it did after the simultaneous international recession of 1974-5 or after the deep slump of 1980-2. Instead it has morphed into a Long Depression, similar to the Long Depression of 1873-97 experienced by the major economies of the United States and Europe or the Great Depression of the 1930s.1
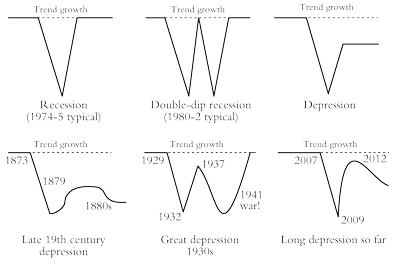
What I meant by this was that the trajectory of world real gross domestic product (GDP) growth and investment resembled what I described as a square root shape. A relatively high trend growth rate was interrupted by a sharp drop, then a sharpish recovery before growth resumed but this time at a much lower level than before. Schematically, it would look like figure 1.
Figure 1: Schematic representations of GDP growth and investment
Source: https://thenextrecession.wordpress.com
I first characterised the state of the world capitalist economy as a Long Depression in my book, The Great Recession.2 Some other economists have since also adopted this characterisation. In 2010 Paul Krugman said:
Recessions are common; depressions are rare. As far as I can tell, there were only two eras in economic history that were widely described as “depressions” at the time: the years of deflation and instability that followed the panic of 1873 and the years of mass unemployment that followed the financial crisis of 1929-31. Neither the Long Depression of the 19th century nor the Great Depression of the 20th was an era of nonstop decline—on the contrary, both included periods when the economy grew. But these episodes of improvement were never enough to undo the damage from the initial slump, and were followed by relapses. We are now, I fear, in the early stages of a third depression. It will probably look more like the Long Depression than the much more severe Great Depression. But the cost—to the world economy and, above all, to the millions of lives blighted by the absence of jobs—will nonetheless be immense”.3
Anwar Shaikh also wrote: “The general economic crisis that was unleashed across the world in 2008 is a Great Depression. It was triggered by a financial crisis in the US, but that was not its cause. This crisis is an absolutely normal phase of a long-standing recurrent pattern of capitalist accumulation in which long booms eventually give way to long downturns”.4
This picture of developments in the major capitalist economies since 2009 has increasingly gained traction even among mainstream economists. As Noah Smith, a Keynesian blogger, put it:
Modern macroeconomists think that recessions and booms are random fluctuations around a trend. These fluctuations tend to die out—a deep recession leads to a fast recovery, and a big expansion tends to evaporate quickly. Eventually, the trend re-establishes itself after maybe five years. No matter what happens—whether the central bank lowers interest rates, or the government spends billions on infrastructure—the bad times will be over soon enough, and the good old steady growth trend will reappear”.5
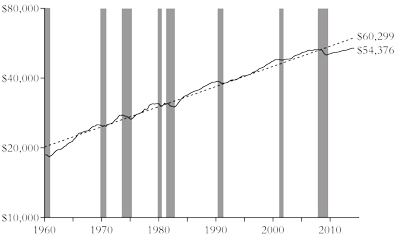
“But what if it’s wrong?” says Smith; what if recessions “deal permanent injuries to an economy”? He pointed out that even right wing economists have criticised the idea that after every recession comes a boom. For example, leading macroeconomist Greg Mankiw, back in 2009, predicted that the Great Recession would herald a lost decade of output as major economies failed to get back to the trend growth rate before the crisis. Ironically, as Smith says, Krugman, a liberal Keynesian, was among the optimists. He was wrong and Mankiw was right. Indeed, the current rate of real GDP growth in the United States is still one third below the long-term average rate in the post-war period of 3.3 percent a year, while US GDP per capita is 9.8 percent below the pre-recession trend (figure 2).
Figure 2: Real GDP per capita in the United States with an exponential regression trendline. Current GDP is at 1.48 percent above the 2007 peak and 9.8 percent below the trendline. Recessions are highlighted in grey.
Source: www.advisorperspectives.com/dshort
Another leading Keynesian, Brad DeLong, has now noticed that the US: “did not experience a rapid V-shaped recovery carrying it back to the previous growth trend of potential output”.6 The trough in the Great Recession of 2008-9 saw the US real GDP drop to 11 percent lower than the 2005-7 trend by the end of 2009. Today it is 16 percent below the pre-crisis trend. Cumulative output losses relative to the 1995-2007 trends now stand at 78 percent of a year’s GDP for the US and at 60 percent of a year’s GDP for the eurozone.
DeLong goes on:
A year and a half ago, when some of us were expecting a return to whatever the path of potential output was by 2017, our guess was that the Great Recession would wind up costing the North Atlantic in lost production about 80 percent of one year’s output—call it $13 trillion. Today a five-year return to whatever the new normal might be looks optimistic—and even that scenario carries us to $20 trillion. And a pessimistic scenario of five years that have been like 2012-2014 plus then five years of recovery would get us to a total lost-wealth cost of $35 trillion.
DeLong concludes that “at some point we will have to stop calling this thing ‘The Great Recession’ and start calling it ‘The Greater Depression’”.7
The US Congressional Budget Office (CBO) reckons that US real GDP will never return to its pre-Great Recession growth path. US real GDP will permanently be 7.2 percent below the pre-Great Recession growth path because trend real GDP continued to rise during the recession. They call this a “purely permanent recession”. The CBO thinks that the US trend growth rate will slow to just 1.7 percent and will never be above 2 percent a year for the foreseeable future.8
A “stop and go” recovery
In its latest World Economic Outlook, the IMF explains that the global economy continues to crawl along at well below the post-war average trend growth rate, with little sign of improvement.9 The IMF argues that the “potential output” of the world economy is growing more slowly than before. In the advanced countries the decline began in the early 2000s; in emerging economies, after 2009. The concern is that the world economy is now characterised by chronic weak investment, low real and nominal interest rates, credit bubbles and unmanageable debt. Christine Lagarde, head of the IMF, described the world’s current economic performance as “just not good enough”.
The IMF expects real GDP growth in the advanced capitalist economies to pick up from 1.8 percent in 2014 to 2.4 percent this year. It needs to see that acceleration to achieve its forecast of world growth at 3.5 percent this year because growth in emerging markets, particularly China and Russia, is slowing or even falling, so that growth there will be only 4.3 percent in 2015, down from 5 percent in 2013.
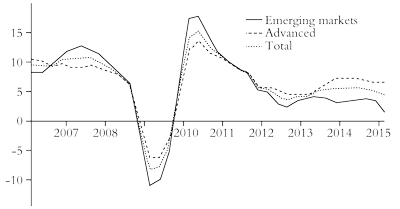
According to the latest Brookings Institute-Financial Times tracking index, the global economy is mired in a “stop and go” recovery “at risk of stalling again”. This “Tiger index” shows measures of real activity, financial markets and investor confidence compared with their historic averages in the global economy and within each country. The Tiger index graph for global growth looks pretty much like the “square root” trajectory that I forecast back in 2009 for the world economy during and after the Great Recession (figure 3).10
Figure 3: Real economic activity
Source: Brookings Institute Tiger index
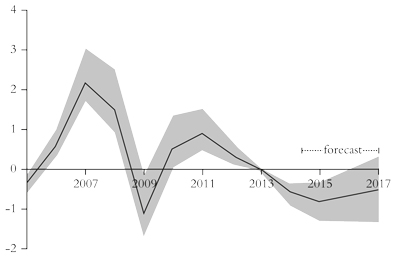
Even more telling is the World Trade Organisation’s annual report.11 Global trade is poised for at least two more years of disappointing growth, according to the WTO (figure 4). Growth in the volume of world merchandise trade will pick up only slightly over the next two years, rising from 2.8 percent in 2014 to 3.3 percent in 2015 and eventually to 4.0 percent in 2016, below the rate of world GDP growth expected by the IMF, WTO economists announced recently. It’s bad news whenever trade grows more slowly than GDP because it means the economies either cannot get out of a depression (Greece) or can achieve only slow growth by exporting as external demand is even weaker than domestic demand.
Figure 4: Growth in volume of world merchandise trade and GDP
Source: World Trade Organisation
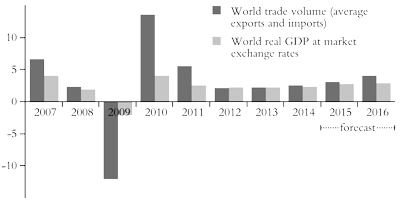
Trade expansion will therefore remain well below the annual average of 5.1 percent posted since 1990. The modest gains in 2014 marked the third consecutive year in which trade grew less than 3 percent. Trade growth averaged just 2.4 percent between 2012 and 2014, the slowest rate on record for a three-year period when trade was expanding (ie excluding years like 1975 and 2009 when world trade actually declined).
For at least three decades before the 2008 financial crisis, in the era of “globalisation”, world trade regularly grew at twice the rate of the world GDP. Roberto Azevêdo, WTO director-general, blamed disappointing trade growth in recent years on the sluggish recovery from the financial crisis. He also warned that economic growth around the world remained “fragile” and vulnerable to geopolitical tensions.
The World Bank has also cut its forecast for global real GDP growth—yet again.12 The bank forecasts the world economy will grow 3.0 percent in 2015 and 3.3 percent in 2016, down from its earlier forecasts of 3.4 percent and 3.5 percent, respectively. Indeed, this lower forecast relies on the US growing at 3.2 percent in 2015, faster than the 2.5 percent rate in 2014. But it made the point that supposedly stronger US economic growth would be unable to compensate for slowing growth and deflation elsewhere; in the eurozone, Japan and the major emerging economies of Russia, Brazil, China, South Africa and Turkey (only India might grow faster this year).
At the same time, world trade growth continues to fall well behind trend before the Great Recession (figure 5). And the so-called emerging economies cannot help as their economies are running well below their full potential. Figure 6 shows developing countries’ output gap. This is measured by subtracting an estimate of potential output (based on maximum capacity utilisation and unemployment levels) from actual output. Therefore a negative value suggests that potential output is higher than actual output.
Figure 5: Global trade volumes (index 2008=100)
Source: World Bank
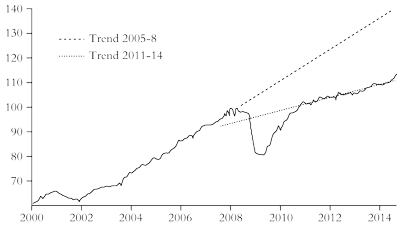
Figure 6: Developing countries’ output gap (as percentage of potential GDP)
Source: World Bank
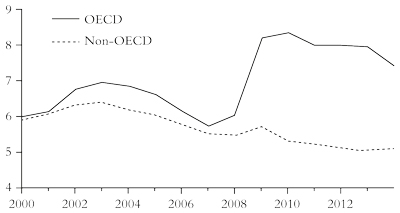
A new report by the IMF shows that, while global unemployment is finally back to levels seen before the global financial crisis, global employment is growing at just 1.5 percent a year, far slower than the 2.0 to 2.5 percent growth rate seen before the crisis.13 The new report shows a striking divergence between advanced and emerging economies. Unemployment in advanced economies stood at 7.4 percent in 2014, far higher than the 5.7 percent seen in 2007 (figure 7). And the report clearly underestimates unemployment in the major emerging economies, which is likely to rise during 2015, as Russia and Brazil go into recession; and growth in China, Turkey and South Africa slows.
Figure 7: Unemployment rates in OECD and non-OECD countries (percentage)
Sources: IMF, ILO, EIU
The spectre of deflation
Everything depends on the US economy making a strong recovery and leading the way out of the global slough of despond. And yet the latest economic data on the US suggest that growth is slowing. The US will be unable to hold the world up like Atlas. A deflationary tsunami is weighing it down.
The optimists hope that the huge fall in energy and other commodity prices towards the end of 2014 has driven the overall rate of inflation of prices of all commodities down. Lower gasoline prices should mean that households in the US and elsewhere can spend more money on other goods and so boost demand. Gavyn Davies, former chief economist of Goldman Sachs and now a columnist for the Financial Times, puts this message:
After several years in which inadequate demand has seriously constrained activity in the global economy, causing repeated downgrades to growth forecasts, 2015 should see an improvement. Lower oil prices and a more demand friendly fiscal/monetary policy mix should result in faster growth in aggregate demand… This will be a year in which excess capacity in the global economy will start to be absorbed.14
Davies expects overall global growth to reach 3 percent. But 3 percent global real GDP growth in 2015 is hardly a boom and is no higher than in 2014. Even this forecast depends on China not slowing down, Europe and Japan avoiding a deflationary depression and the US continuing to accelerate as consumers spend more from the extra income they get from falling gasoline prices.
While Davies may be optimistic about global economic growth in 2015 because of “higher” demand, Timothy Adams, the president of the Institute of International Finance, which represents the world’s largest banks, insurance companies and pension funds, is much less so: “The question is, can a wealth effect in a liquidity-juiced US economy provide the engine of growth for the global economy… One could have a fairly pessimistic outlook on global growth if you take all these things into consideration.” Here Adams doubts that rising prices in financial assets (stocks and bonds) generated by central bank credit injections will revive the world economy.15
The slowdown in most economies combined with the sharp fall in energy prices has raised the spectre of deflation in the major capitalist economies for the first time since the Great Depression of the 1930s. In December 2014 the eurozone fell into deflation for the first time in more than five years. Japan is nearly back there and US and UK annual inflation rates are well under central bank targets of 2 percent a year.
The Economist magazine is worried. As the magazine explains:
The drop in oil prices is in part due to higher supply, but it is also the product of slowing growth around the world. China’s slackened appetite for raw materials has hit emerging-market commodity suppliers particularly hard. And an energy-induced drop in prices, though good for consumer purchasing power, risks reinforcing expectations of lower inflation overall; it is part of the threat’s pernicious nature that such expectations easily become self-fulfilling.16
While lower prices may benefit average households in reducing their energy bills so that they can spend more on other things, deflation puts downward pressure on the profitability of capitalist production. This might inspire the introduction of new technology to lower costs. But there is little sign of that at present in the major capitalist economies. The energy producers are cutting back on investment globally (some 40 percent of total capital investment), but other sectors are not compensating.
On the contrary, most capitalist firms are continuing to try and boost profitability through raising profit margins by holding down wages. A recent staff paper by the Federal Reserve Bank of San Francisco argued that “wage stickiness” had hampered American firms’ ability to adjust costs during the Great Recession.17 The paper says that wage rates stayed up “too much” during recession, so firms would rather not raise wages now in the recovery. Now if sales demand and price rises should slow again, there could be a “pent-up” demand to cut more jobs. So the improvement in the US job market could grind to a halt.
The other problem with low inflation and/or deflation is that the real value of existing debt owed by firms and households rises. If the Fed goes ahead with its plan to raise interest rates later this year, then the cost of servicing that debt will rise, hitting the ability of companies to invest and households to spend. Since the financial crisis struck in 2008 the world has become more leveraged; total public and private debt reached 272 percent of developed-world GDP in 2013, according to a report put out under the aegis of the Geneva Reports on the World Economy.18 A new report by McKinsey reckons that world capitalism has never been so awash with debt.19 Global debt has increased by $57 trillion since 2007 to almost $200 trillion—far outpacing GDP growth. As a share of world GDP, debt has risen from 270 percent to 286 percent, despite the cleansing of the Great Recession. Capitalism is not out of the woods.
Overall, almost half of the increase in global debt since 2007 was in developing economies, but a third was the result of higher government debt levels in advanced economies. Households have also increased debt levels across economies—the most notable exceptions being crisis-hit countries such as Ireland and the US. China’s total debt, including the financial sector, has nearly quadrupled since 2007 to the equivalent of 282 percent of GDP.
In a new paper, David Papell and Ruxandra Prodan at the University of Houston find that deep recessions after a financial crash can take up to nine years before growth returns to trend. But this time it is different—it’s even worse.20
A new report from the OECD presents a dark picture for global capitalism:
The global economy continues to run at low speed and many countries, particularly in Europe, seem unable to overcome the legacies of the crisis. With high unemployment, high inequality and low trust still weighing heavily, it is imperative to swiftly implement reforms that boost demand and employment and raise potential growth. The time to act is now. There is a growing risk of persistent stagnation, in which weak demand and weak potential output growth reinforce each other in a vicious circle.
Even more starkly, the report goes on to to say:
The cylinders of the world economy continue to fire at only half speed. Growth is low and uneven and some parts of the world, such as the euro area, are at risk of falling into a trap of persistent stagnation, an extended period of low overall economic activity and low employment despite extraordinary monetary stimulus. A vicious circle is developing, with weak demand undermining potential growth (eg via a deterioration of the capital stock, structural unemployment and higher inequality) and weak potential growth further reducing demand (eg by discouraging capacity-expanding investment).21
Explaining the depression
Why is capitalism locked into a depression? Well, mainstream economics has debated this “secular stagnation”, the term first used in the immediate post-war period by Keynesian economist Alvin Hansen who extrapolated Maynard Keynes’s theory to mean the gradual slowdown in growth. Secular stagnation could have two causes: either permanently lower productivity growth and declining innovation (a “supply-side” problem) or too high rates of interest and/or insufficient “animal spirits” to stimulate investment (a “demand” problem).
At a 2013 IMF conference on the causes of the crisis,22 Larry Summers, former Goldman Sachs executive, ex-US Treasury secretary, ex-president of Harvard University and failed candidate for the head of the US Federal Reserve, pronounced that the efforts of central banks to return economies to “normal growth” were not working. Reviving the economy with low or zero interest rates, or the “printing of money” through quantitative easing (QE)-type purchases of government and private sector financial paper, were not restoring growth: “Even a great bubble wasn’t enough to produce any excess of aggregate demand… Even with artificial stimulus to demand, coming from all this financial imprudence, you wouldn’t see any excess…the underlying problem may be there forever.” So: “we may well need in the years ahead to think about how to manage an economy where the zero nominal interest rate is a chronic and systemic inhibitor of economic activity, holding our economies back below their potential”.23
Apparently even “unconventional” monetary policies are not doing the trick for the economy, except to drive up stock market prices in a new (non-inflationary) bubble. As Krugman put it in a blog post called “A Permanent Slump?”: “What if the world we’ve been living in for the past five years is the new normal? What if depression-like conditions are on track to persist, not for another year or two, but for decades?” Krugman argued there is a case for “‘secular stagnation’—a persistent state in which a depressed economy is the norm, with episodes of full employment few and far between?”24 He went on:
Summers’s answer is that we may be an economy that needs bubbles just to achieve something near full employment—that in the absence of bubbles the economy has a negative natural rate of interest. And this hasn’t just been true since the 2008 financial crisis; it has arguably been true, although perhaps with increasing severity, since the 1980s.25
So it appears that the major capitalist economies cannot grow at rates that would achieve full employment any longer (if they ever did) even with negative real interest rates.
So Keynesians may now accept that the world capitalist economy is in depression but their explanation for this remains sharply different from a Marxist one. First, for the Keynesians, the depression is a product of money hoarding by capitalists leading to a permanent lack of “effective demand”. But what the likes of Krugman do not explain is why this hoarding suddenly happened and why it won’t end, even with negative real rates.
Second, according to Krugman this secular stagnation may be caused by “slowing population growth” keeping effective demand low (let’s have more babies) or it may be caused by “persistent trade deficits” which emerged in the 1980s and “since then have fluctuated but never gone away”. The first explanation looks outside of the motions of capitalist accumulation to some exogenous law of nature and the second really refers to imbalances between capitalist economies, rather than capitalism as a world economy. Both explanations deny any fault in the fundamental workings of modern capitalism and neither sounds convincing.
Fellow Keynesian and Financial Times columnist Martin Wolf reckons the cause of this new depression is a “global savings glut” or a “dearth of investment” caused by “excessive hoarding” of savings by capitalists unwilling to invest: “the world economy has been generating more savings than businesses wish to use, even at very low interest rates. This is true not just in the US, but also in most significant high-income economies”.26 So the problem of the Long Depression is a surplus of savings (profits), not low profitability.
This is a hoary old argument that originated from Ben Bernanke, the former chairman of the Fed, back in the early 2000s, when he argued that the “persistent trade deficits” in the US and Britain were caused by “too much saving” in the “surplus” countries of Asia and OPEC. Thus the credit binge and the subsequent credit crunch were really the fault of the likes of Japan or China not spending enough on US goods. But now the depression is caused by everybody not spending enough. Again the question is why are people not spending enough? That’s not difficult to answer when it comes to average households, decimated by reduced incomes and unemployment, but why don’t capitalist companies in the US or Europe invest more? Wolf thinks it may be due to “excessive debt” being built up during the credit binge before the Great Recession. So the crisis was caused by “excessive spending” and now the depression is caused by “excessive saving”—capitalism just swings from one to the other!
Wolf also thinks the failure to invest may be due to a change in the culture of capitalist firms, which no longer want to invest in productive capital but prefer to play the stock market or buy financial assets. The idea that the depression may have something to do with profitability of capital in what is, after all, a profit economy—one where people invest to make a profit—by definition, is totally absent from Keynesian explanations.
Roger Farmer, Professor of Economics in Los Angeles, has his own idiosyncratic view.27 Farmer reckons that economies are driven by “animal spirits” ie bursts of enthusiasm and depression among capitalists to invest or not. As Noah Smith puts it: “A burst of pessimism can knock the economy from a good equilibrium into a bad one and it can then stay there until a burst of optimism comes along to knock it back”.28
Then there is the supply-side explanation. A recent paper by three economists finds that long-run US real GDP growth has been declining for some time and the main reason is a slowdown in the growth of the productivity of labour (figure 8).29 Capitalists are failing to boost productivity growth enough through new technology. Two more economists show that labour productivity in the major economies has been persistently weak since the onset of the global crisis:
We find that persistently weak productivity is not normally a feature of financial crises in advanced economies—this time has been different. Looking sector by sector, the biggest falls in most countries have been in manufacturing. The UK stands out in having also seen a dramatic fall in service sector productivity growth, now one of the slowest in our sample of countries.30
Figure 8: Annual percentage growth (as 15 year centred moving average)
Source: Furnam, 2014
Robert Gordon from Northwestern University has presented the most compelling “supply side” case for secular stagnation.31 The US economy has slowed to a crawl not because population growth will slow as the original proponent of secular stagnation, Alvin Hansen, argued in the late 1930s (but that too), but because the productivity of labour will stop growing at anything like fast enough. The reason is that the major capitalist economies have run out of innovation and technology to boost productivity. According to Gordon, even the hi-tech internet revolution of the 1990s failed to raise productivity growth in the whole economy, compared to the industrial revolution of the 19th century or the electrical/auto revolution of the early 20th century. And now the internet revolution is nearly exhausted without significant new innovations.
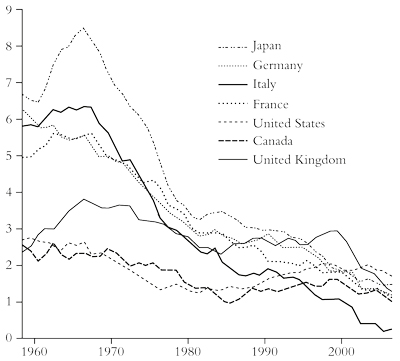
So the ability of capitalist accumulation to foster economic growth will be slower than in any extended period since the Civil War, when US capitalism first sprang onto the world arena. Gordon suggests that capitalism drove the productive forces (and thus economic growth) upwards from about 1750 to 1950. But now we are in the downward spiral of capitalism that no longer takes the productive forces forward. He exhibits this in a graphic showing UK and US economic growth rates over the period (figure 9). Capitalism, at least in the mature economies, has had its day.
Figure 9: The end of the line for capitalism? UK and US economic growth rates over the long term
Source: Gordon, 2012
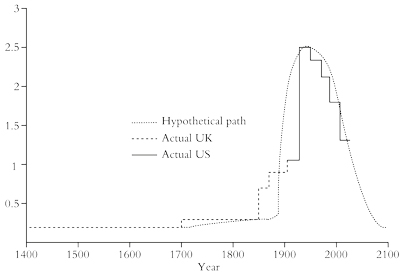
Naturally, Gordon’s forecasts have not been well received by either Keynesian or neoclassical economists. Many critics of Gordon’s view argue that this slowdown is temporary and is caused by the effects of the Great Recession and the cyclically weak recovery since. Once capitalists start to invest more, productivity growth will recover to the previous trend. The only problem with that argument is that there is still little sign of any significant return to the previous trend in business investment growth.
Kenneth Rogoff pitched in on Gordon’s predictions. He agreed that there were obstacles to continuing the “previous success” of capitalism. Yet he remained optimistic that capitalism can overcome these challenges, arguing that technological progress has trumped obstacles to economic growth in the past. After all, “so far, every prediction in the modern era that mankind’s lot will worsen, from Thomas Malthus to Karl Marx, has turned out to be spectacularly wrong…despite a disconcerting fall in labour’s share of income in recent decades, the long-run picture still defies Marx’s prediction that capitalism would prove immiserating for workers. Living standards around the world continue to rise”.32
So what is to be done?
How can capitalism get out of the slow crawl that the Long Depression exhibits? Up to now most governments in capitalist economies have engaged in what are loosely called “austerity” policies since the end of the Great Recession in 2009. More precisely, governments aim to reduce their annual deficit on spending and revenues and shrink the overall debt burden, plus introducing “reforms” to weaken labour rights and conditions at work and keeping wage costs down for the capitalist sector. The fiscal part of these austerity measures mainly involved cutting back on government spending, both in public sector employment, wages, public services and investment projects.
Those economists and governments who advocated austerity claimed that, by getting debt “under control”, costs would be reduced and companies would invest, consumers would spend and economies would recover quickly. Keynesians and others who opposed these measures reckoned that austerity would drive down “aggregate demand” as government spending was cut, taxes rose and wages were held down. The way out of the crisis was to borrow more, not less, and spend more, not less.
The “Austerians” recognise that the key to a capitalist economy recovering is to reduce costs for the capitalist sector by cutting wages and government taxation so that profitability can rise. Raising wages or increasing government spending, as the Keynesians advocate, would reduce profitability at a time when it needs to rise. However, the Keynesians recognise that, once an economy is in a slump and labour incomes are falling, cutting them further can worsen the fall in consumer spending and investment demand for some time. It’s not quite Catch 22, but looks like it for a while.
In a recent study the IMF considered the question of whether austerity worked. The IMF found that if governments did not spend too much when economies were growing and spent more when economies were in a slump, then this would act as a counter-cyclical buffer to the volatility of the capitalist sector. The IMF quantified this effect as cutting “output volatility by about 15 percent, with a growth dividend of about 0.3 percentage points annually”. The IMF optimistically reckoned that: “Stability, growth and debt sustainability could all greatly benefit if measures that destabilise output, such as spending increases in good times, were avoided”.33
But this is the classic sort of fiscal management policy advocated by mainstream economics back in the 1960s that was supposedly the answer to controlling capitalist booms and slumps. Governments could smooth economic fluctuations by judicious (and even automatic) fiscal “stabilisers”. Yet this policy (in so far as it was even implemented) proved a total failure during the 1970s, when the major capitalist economies experienced inflation and unemployment together and government fiscal management failed. Indeed, governments probably increased volatility by stimulating or applying austerity at the wrong times.
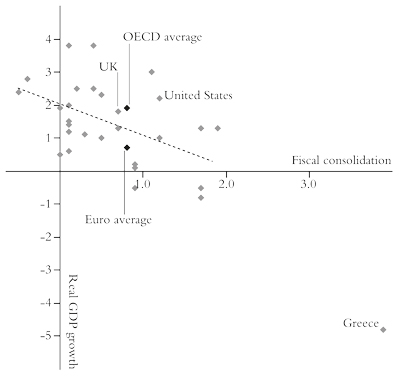
So has austerity worked in getting economies to recover quicker since 2009 or have austerity measures made it worse? Figure 10 covers 30 advanced capitalist economies for changes in real GDP growth and reductions in government budgets since 2010.34 The further to the right a country, the more austerity there has been—with Greece leading the way. The further up the graph a country is, the more growth there has been since 2010. The graph trendline appears to show that tightening the budget by 1 percent of GDP cuts about half a percentage point off the growth rate, even if we omit Greece.35 But the correlation is not very strong. The US underwent more fiscal consolidation than Britain in 2010-14, but it also had better growth. On the other hand, the countries of the eurozone, on average, grew more slowly than the OECD average despite a similar average level of austerity. So factors other than the fiscal policies of governments were much more important for post Great Recession growth.
Figure 10: Austerity versus growth in the OECD—annual averages 2010-14
Source: Dolan, 2015
As for the other arm of austerity, “labour market reform” (ie weakening trade unions, increasing the ability of employers to hire and fire at will, deregulating contracts and hours and job qualifications), have they worked? These measures are advocated by the IMF, the OECD and by the European institutions in their current negotiations with Greece. But a new study by IMF economists found no evidence that such “reforms” could have a positive impact in increasing growth potential”.36 What they found was that more competition among capitalists in markets and higher investment spending contributed much more in boosting productivity than squeezing the conditions for the workforce.
What the IMF did not consider was that while more investment in new technology might raise productivity per worker, cutting wage costs and weakening labour’s bargaining power can deliver more profitability quicker. It might be short-sighted, but the capitalist mode of production does not take the long view.
In short, austerity has not worked in restoring trend economic growth, although it has not made things much worse either. The problem is that cutting wage costs and holding back on government investment and spending has not sufficiently restored profitability nor reduced debt to allow a significant rise in new investment. The alternative policy of Keynesian-type government spending might have helped labour a little, but it would not have boosted investment and growth either, as it would have lowered profitability. Governments appear helpless to change things either way.
As nominal interest rates cannot be lowered much (they are “zero-bound”), the OECD backs the current policy of central banks printing money to buy government bonds, stocks and company bonds (so-called quantitative easing). And it wants governments to stimulate economies by spending more on investment in infrastructure. Its model for recovery is apparently the actions of the Japanese government: “With Japan’s launch of the ‘three arrows’ in 2013 [the plan for economic growth that Shinzo Abe launched after becoming prime minister], the EU’s recent launch of an investment plan and the euro area’s expected move towards quantitative easing, the likelihood of escaping the stagnation trap is increasing.” But it won’t be enough: “further action is needed to sustain this positive reform momentum”. And what could this be? “Structural reforms are urgently needed to remove regulatory bottlenecks to investment, reduce the administrative burden for business, and facilitate company restructuring”.37
In effect, the OECD wants even more deregulation in business practices, complete “flexibility” in labour markets and more free trade, particularly in services: “reducing regulatory barriers… Further dismantling border and behind-the-border barriers to the international movement of goods and services will serve both to expand demand and make markets more competitive and dynamic.” In other words, the OECD wants more neoliberal policies to allow “market forces” to work. In effect, it wants “free markets” in labour to keep wage costs down and free movement of capital internationally to raise profitability.
The monetarist wing of mainstream economics, as represented by the likes of Ben Bernanke, the Bank of Japan, the Bank of England and now Mario Draghi at the ECB, reckons that when central bank interest rates are near zero (or even below as in Switzerland and Sweden), a good dose of money printing, or “quantitative easing”, can do the trick in getting an economy going. However, this has proved to be a delusion. Most of this extra credit or money has ended up in the stock and bond markets and in the cash reserves of the banks; very little has found its way to the so-called “real economy”.
The Keynesian wing of the mainstream has argued that just printing more money is not enough: there must be fiscal expansion—ie government spending—to get capitalist economies out of their “secular stagnation”. Simon Wren-Lewis, Oxford economist and the British counterpart of Paul Krugman in the US, has recently argued that the policy of fiscal austerity pursued by the US, British, and European governments after 2010 was the main reason why the recovery after the Great Recession has been slow in the major capitalist economies. In the US real GDP growth was held back a full percentage point per year from 2010. More fiscal spending and all would have been well.38
Such an argument is based on the size of the spending “multiplier”—ie the rate at which higher spending increases economic output. Wren-Lewis applies a multiplier of 1.5. In other words for every 1 percent of GDP increase in government spending, there would be a 1.5 percent rise in real GDP. Actually, there is a big dispute about what the spending multiplier actually is, with some studies arguing for a multiplier of less than one. And then there is the causal sequence: was austerity the product of the collapse in the real economy in 2009 or was the slow recovery a result of austerity?
What Guglielmo Carchedi calls the Marxist multiplier is the most relevant driver of economic growth. What matters is whether profitability in the productive sectors of the capitalist economy rises or falls. From this will flow increased investment, employment and the ability to raise government spending. Increased government spending may boost consumer demand for a while, but at the expense of profitability.39 So it cannot last as a way out of crises.
The role of profit
In none of these mainstream explanations of the Long Depression is there a mention of what is happening to the profitability of capital, although the dominant mode of production in the world economy is one of production for profit. Of course, this is no accident. If mainstream economics were to consider an explanation of the depression based on the profitability of capital it would suggest that capitalism had a chronic problem of recurrent and regular crises that are only resolved through slumps in production and at the expense of the living standards of the majority.
The world capitalist economy has entered a Long Depression and not recovered from the Great Recession in the “normal way” because the profitability of capital in the major economies has not recovered. Indeed, global profitability is at an all-time low. The Marxist theory of crisis argues that there is a tendency for the rate of profit to fall over time as capitalism expands and capital accumulates. This tendency can be counteracted for periods of time by higher rates of exploitation of labour and by faster innovation. But the tendency will eventually apply in lowering profitability. This law of the tendency of the rate of profit to fall, Marx reckoned, was the most important law of political economy. It both was a secular tendency and showed that capitalism was a transitory mode of production in human social organisation with a use-by date. It also generated cyclical fluctuations in output and employment, so that capitalist production was not harmonious but punctuated by violent slumps.40
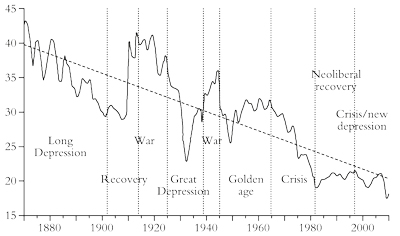
If we look at the movement of the rate of the profit in the major economies over the last 150 years since capitalism has been the dominant mode of production globally, the reason for the current Long Depression becomes clearer. Figure 11 (the simple mean average world rate of profit from the work of Esteban Maito, as interpreted by me) shows that global profitability is in a “winter” downphase, similar to the fall in profitability experienced between 1870 to the end of the 19th century and the Great Depression of the 1930s.41
Figure 11: World rate of profit, simple mean (percentage)
Source: Maito, 2014, adapted by author
In the most important capitalist economy, the US, the rate of profit has been in secular decline since the end of the Second World War. There was a “golden age” from 1946 to 1965, when profitability held up (at least on the current cost measure)42 but then there was a period of sharply falling profitability (the crisis period) from 1965 to 1980-2. From 1982 to 1997 there was a significant revival in profitability (on a current cost basis) and a small pick-up or end to the decline (on a historic cost basis)—the neoliberal period, if you like. From 1997 the US rate of profit entered a downward phase. Since the end of the Great Recession profitability revived from lows in 2009 but is still below the level reached in 1997. It fell in 2014.
Marx’s law of the tendency of the rate of profit to fall is just that: the rate of profit in a capitalist economy will tend to fall over time. But there are periods when counteracting factors come into play, so the tendency to fall does not materialise in an actual fall for a period of time. Thus you can get a profit cycle of falling profitability followed by a period of rising profitability and then a new fall, all within a secular process of decline. The US rate of profit in the post-war period exhibits just that with a 32 to 36 year cycle from trough to trough.43
Marx’s law says that the rate of profit will fall because there will be a rising organic composition of capital (the value of constant capital, machinery, plant and raw materials, will rise faster than variable capital, wages and benefits paid to the employed workforce). The US data confirm that. There is a strong inverse correlation (-0.67) between the organic composition of capital and the rate of profit. The organic composition of capital rose 20 percent from 1946 to 2014 and the rate of profit fell 20 percent. In the period when profitability rose, from 1982 to 1997, counteracting factors came into play, in particular a rising rate of exploitation (surplus value) and a cheapening of the value of constant capital leading to a fall in the organic composition. In that period the rate of surplus value rose 13 percent and the organic composition of capital fell 16 percent. The rise in the rate of profit from 1980 to 2014 was two thirds due to a rise in exploitation of labour during the neoliberal period and only one third due to cheaper technology.44 Again this supports Marx’s law.
Marx argued that slumps in capitalist production came about when profitability fell to such a level that the cost of new investment in labour and technology rose more than the profits gained, so that the mass of profit began to fall. Once that started to happen, the weakest companies began to make huge losses and so laid off labour and stopped investing. This downturn in employment and investment then cascaded through an economy, generating an overall crisis in production. Then any debt liabilities that had been racked up in order to invest, or to speculate in the stock market or in real estate to boost profitability, could not be paid and the profit crisis would trigger a financial crisis. In turn, this financial crisis would bring about an even greater fall in investment and production.
This Marxist explanation differs from the Keynesian one. The latter supposes that investment is autonomous and responds basically to relative “confidence” in the prospects of businesses, to “animal spirits”, so that present profits are determined by current investment and investment in the recent past. The Marxist view is that investment depends on profitability, so that movements in investment respond to previous movements in profits.45
The evidence for the Marxist view is strong. For example, José Tapia Granados found that in each of the five major recessions in the post-war period profitability was falling as it had reached a peak at least one or two years earlier. Indeed, peaks in the share of profits before taxes are observable in 1973 before the First Oil Crisis, in 1978 before the Second Oil Crisis, in 1988 before the Eastern Europe Crisis, in 1997 before the Asian Crisis and in 2006 before the Great Recession.46 Tapia Granados also found that over 251 quarters of US economic activity from 1947 profits started declining long before investment did and that pre-tax profits can explain 44 percent of all movement in investment, while there is no evidence that investment can explain any movement in profits.47
And in a paper I co-wrote with Guglielmo Carchedi we found that profits fell for several quarters before the US economy went into a nose dive.48 US corporate profits peaked in early 2006—that’s the absolute amount, not the rate of profit, which peaked earlier in 2005. From its peak in early 2006 the mass of profits fell until mid-2008, made a limited recovery in early 2009 and then fell to a new low in mid-2009. After that the recovery in profits began and the previous peak in nominal dollars was surpassed in mid-2010.
What was the reaction of investment to this movement in US profits? When US corporate profit growth started to slow in mid-2005 and then fell in absolute terms in 2006, corporate investment went on growing for a while as companies used up reserves or increased borrowing in the hope that profits would be restored. But when that did not materialise, investment growth slowed during 2007 and then fell absolutely in 2008, at one point falling at a near 20 percent year on year rate. Profits started to recover at the end of 2008 but investment did not follow for a year. It was the same for GDP. GDP peaked well after profits did and recovered after profits. The movement of profits leads the movement of investment—not vice versa. Profits were falling well before the credit crunch began. So the crisis was not due to a lack of “effective demand”, but followed the Marxist law of profitability, even if the eventual trigger for the slump was in the financial sector.
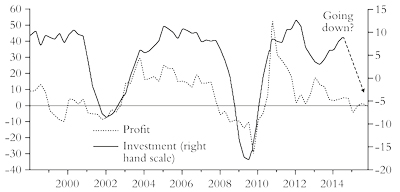
What is happening to corporate profits now?
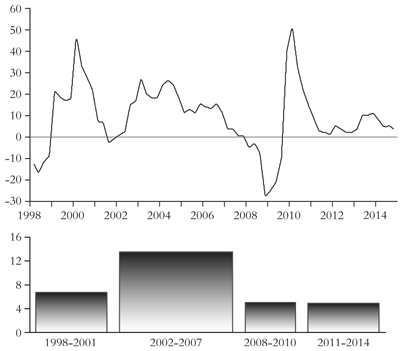
Corporate profits in some of the major capitalist economies, namely the US, Britain, Japan, China and Germany, have been slowing sharply, from 11 percent year on year this time last year to just 3.2 percent at the end of 2014 (figure 12).
Figure 12: Global corporate profits (percentage year on year) bars show average annual growth in global corporate profits
Source: US Bureau of Economic Analysis, author’s calculations
In the US, corporate profits fell in the fourth quarter of 2014, down 0.8 percent compared to 2013. When corporate profits slow, some six months to a year later, so will business investment. That would suggest a new investment slump before the year is out (figure 13).
Stock markets around the world remain at, or near, all-time highs. But we may well be near the end of this stock market bonanza, six years after the Standard & Poor (S&P) 500 Index embarked on a bull run, resulting in a rally of 250 percent, including the reinvestment of dividends. Not since the aftermath of the financial crisis have S&P 500 companies recorded two straight quarters of falling profits on a year over year basis. Analysts are forecasting a decline of 4.6 percent in S&P 500 earnings in the first quarter of 2015 compared with the same period a year ago, with those for the second quarter falling 1.5 percent. That would represent the first back to back quarterly decline since the second and third quarters of 2009 at the depth of the Great Recession.
Figure 13: US corporate profits (advanced one year) and business investment (percentage change year on year)
Source: Author’s calculations
Increasingly, the stock market has been supported simply by an injection of billions in credit by the Federal Reserve. Financial firms and non-financial corporates have been flush with cash that they have raised from the issuance of corporate bonds at extremely low rates of interest. This cash has then been invested in the stock market and in paying out dividends and buying back stock, so encouraging others to buy stocks. Only a small proportion has been used to invest in new technology and more labour.49
Profits have also been artificially sustained by significant cuts in corporation tax and other exemptions from tax. For example, Warren Buffett’s investment company, Berkshire Hathaway, has been able to defer $62 billion in taxes, that’s eight years of taxes, because the company has bought capital intensive businesses like railways and power utilities. That has given the company even more funds to invest in the stock market. Berkshire’s Energy unit receives tax credits for renewable power generation—reporting $258 million in wind energy tax credits in 2014, and $913 million in investment tax credits in 2012 and 2013 for opening new solar power plants. This is interest-free borrowing made possible by the taxpayer because of the business friendly government.
But the days of low interest borrowing and investment speculation are about to come an end. It seems that the Federal Reserve is going to start raising the floor on interest rates some time this year, leading to rising mortgage and corporate bond rates. That could spark a significant drop in stock market prices and even kick off a new recession.
Back in 1937 during the Great Depression it appeared to the US authorities that the slump was over and it was time to “normalise” interest rates. On doing so, the economy promptly dropped back into a new recession that was only overcome when the US entered the Second World War in 1941. The reality was that the profitability of capital and investment had not really recovered and raising the cost of borrowing tipped the economy back.
But why would the Fed do this if there is such a danger? Precisely because it wants to cool a speculative stock and bond market and, most important, avoid a sharp rise in wages that could squeeze profits as the labour market tightens. If the Fed does move later this year, it could start to expose just how much fictitious capital (as Marx called stock and bond investment) has built up in the US and other economies and see it go up in smoke.
So in sum, the US rate of profit fell in 2014 for the first time since 2008. Over the year total profit growth slowed compared with 2013 and even fell in the last quarter. All this suggests that the days (years?) of the economic recovery, such as it is, may be coming to an end. The current economic cycle of boom and slump seems to be about eight to nine years. The trough of the last slump was mid-2009. That would suggest that the next trough would be about 2017-18. And the peak before the slump is usually 12 to 18 months before—so about 2016-17.
Obviously, sucking a forecast out of the air is no better than choosing a number in a lottery. A forecast is only as good as the theory behind it. But Marx’s theory of crisis provides the best explanation of the Great Recession in 2008-9 and also allows us to discern the stage through which capitalism is going and where it is going. But, as Frederick Engels said: the proof of the pudding is in the eating.
Notes
1: Roberts, 2013.
2: Roberts, 2009.
3: Krugman, 2010.
4: Shaikh, 2010.
5: Smith, 2015.
6: Go to http://equitablegrowth.org/2014/08/28/start-calling-greater-depression-early-friday-focus-august-29-2014
7: Go to http://equitablegrowth.org/2014/08/28/start-calling-greater-depression-early-friday-focus-august-29-2014
10: FT-Brookings Tiger index, www.brookings.edu/research/reports/2015/04/12-global-economic-recovery-prasad
13: IMF, http://blog-imfdirect.imf.org/2015/04/28/close-but-not-there-yet-getting-to-full-employment-in-the-united-states
14: Davies, 2015.
16: Go to www.economist.com/news/briefing/21627625-politicians-and-central-bankers-are-not-providing-world-inflation-it-needs-some
17: Daly and Hobijn, 2015.
19: McKinsey Global Institute, 2015.
20: Go to http://econbrowser.com/archives/2015/02/guest-contribution-long-term-effects-of-the-great-recession
21: Go to www.oecd.org/economy/escaping-the-stagnation-trap-policy-options-for-the-euro-area-and-japan.pdf
23: Quoted in Kaminska, 2013.
24: Krugman, 2013a.
25: Krugman, 2013b.
26: Wolf, 2013.
27: Go to www.rogerfarmer.com
28: Smith, 2015.
31: See Gordon, 2012, and Gordon, 2014.
32: Rogoff, 2014.
34: Dolan, 2015.
35: Dolan, 2015.
37: Go to www.oecd.org/economy/escaping-the-stagnation-trap-policy-options-for-the-euro-area-and-japan.pdf
39: Carchedi, 2012, and https://thenextrecession.files.wordpress.com/2012/10/carchedi-and-the-marxist-multiplier.pdf
40: These theoretical issues are continually debated by Marxist economists. For an account of the recent debate raised by Michael Heinrich on Marx’s theory of crises, see Carchedi and Roberts, 2013a.
41: Maito, 2014.
42: Fixed assets (factories, equipment, buildings, etc) can be measured in historic costs (the price that they were first bought at) or in current costs (what it would cost now to replace them). There is controversy in Marxist economic theory about whether the law should be applied and measured in historic or current costs. I offer both measures.
43: For more on this, see Roberts, 2009.
45: Yanis Varoufakis criticises Marx’s theory of crises as failing to explain depressions as opposed to slumps: “Marx told the story of redemptive recessions occurring due to the twin nature of labour and giving rise to periods of growth that are pregnant with the next downturn which, in turn, begets the next recovery, and so on. However, there was nothing redemptive about the Great Depression. The 1930s slump was just that: a slump that behaved very much like a static equilibrium—a state of the economy that seemed perfectly capable of perpetuating itself, with the anticipated recovery stubbornly refusing to appear over the horizon even after the rate of profit recovered in response to the collapse of wages and interest rates”—see “Confessions of an Erratic Marxist”—http://tinyurl.com/p3brwpj. It could be retorted that Keynesian theory does not explain the reason for slumps.
46: Tapia Granados, 2014.
47: Tapia Granados, 2013.
48: Carchedi and Roberts, 2013b.
References